Forecasting and energy systems
Australian electricity demand forecasting
Predicts measured operational demand for the next half hour across Australia’s National Electricity Market (NEM), using public AEMO data.
Measured-demand historical benchmark
The question
How accurately can recent demand and calendar information predict electricity demand for the next half hour? This project forecasts measured operational demand across Australia’s National Electricity Market (NEM), using public data from the Australian Energy Market Operator (AEMO). Operational demand excludes electricity supplied by sources such as household rooftop solar.
What I built
The pipeline downloads monthly measurements, checks timestamps and regional coverage, builds features from completed intervals, and compares random forest and XGBoost with three baselines. It saves the predictions, errors, model settings, and source records needed to inspect the run.
The target uses original half-hour measured values, without adding operational-demand adjustments or estimates of wholesale demand response. A NEM total is calculated only when all five regions are present. Valid negative regional measurements are retained, and the evaluation follows the order of the observations.
Historical pilot results
The October–December 2024 dataset contains 4,416 complete half hours. The final test contains 612 forecasts issued between 19 and 31 December. Both machine-learning models achieved lower mean absolute error than the three baselines on this test.
| Method | Error (MW) |
|---|---|
| Persistence | 487.30 |
| Previous day | 1,026.53 |
| Previous week | 2,134.83 |
| XGBoost | 183.37 |
| Random forest | 177.94 |
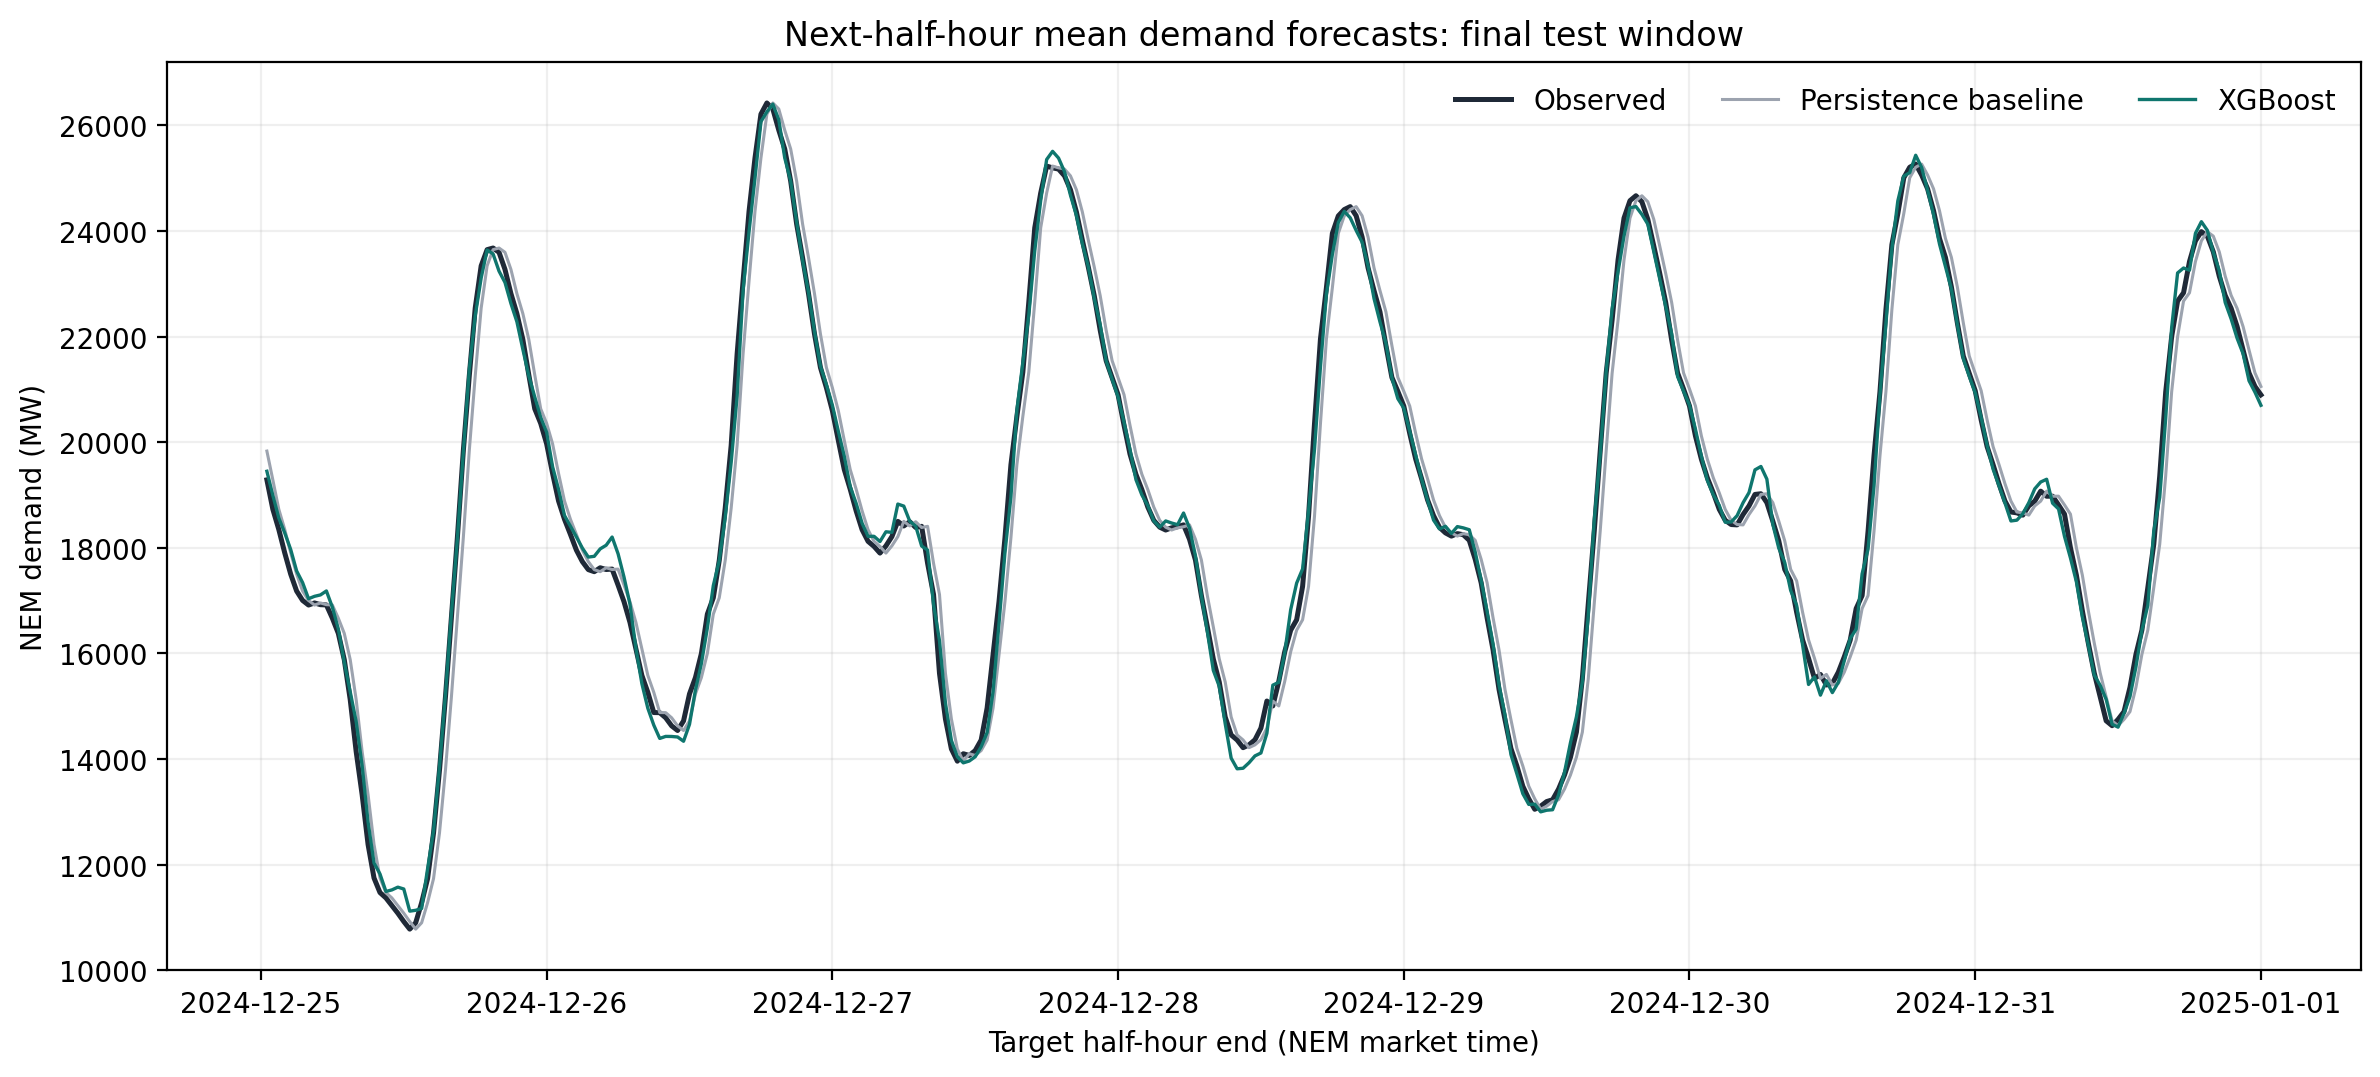
What comes next
This pilot covers one quarter, with a test period near its end. The historical evaluation assumes completed measurements are available immediately and uses archived values, including later revisions. Testing other seasons and realistic publication delays would show how well the approach transfers to ongoing forecasting.